
this article focuses on apex game servers operating in south korea. it explains how to standardize server naming, what management and monitoring tools to use to improve stability, how to configure alarms and visualization, and provides practical suggestions for operation and maintenance and product teams to help reduce delays, reduce disconnections, and improve player experience .
where can i view or modify the apex korean server name ? what should i pay attention to?
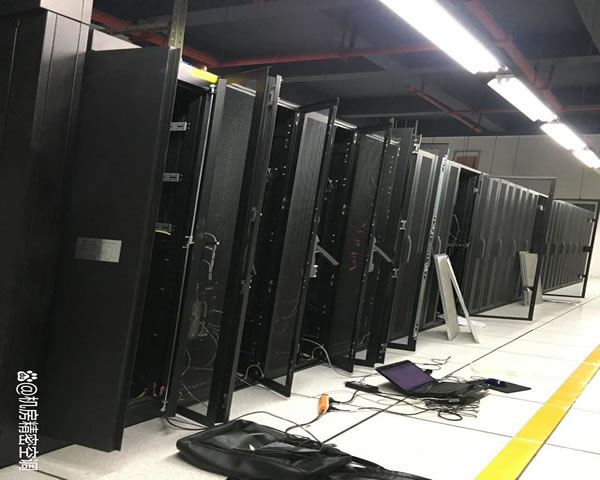
the server name usually exists in the game server control panel, dns records, or cloud service console. instances hosted on cloud platforms (such as aws, gcp, alibaba cloud) should be named uniformly on instance tags and load balancers; for self-built computer rooms, they should be synchronized in internal cmdb and dns records. the naming convention should include region (kr), environment (prod/stage), computer room number and purpose (match/game). for example: kr-prod-game-01. unified naming facilitates monitoring and filtering, alarm grouping, and troubleshooting, and avoids misoperations caused by confusion with the same name.
how many key indicators need to be monitored to ensure stable operations?
it is recommended to monitor at least the following five key indicators: network latency (rtt), packet loss rate, bandwidth usage, server resources (cpu/memory/disk i/o) and application layer indicators (player concurrency, matching queue length, tick rate, abnormal disconnection rate). these indicators can cover link problems from the network to the application, allowing operation and maintenance personnel to quickly locate bottlenecks. for games that are sensitive to player experience , perceptual detection should also be added, such as synthetic client-server heartbeats, simulated player connection tests, and regionalized speed measurement points.
which monitoring and management tool is suitable for game servers in south korea?
there is no universal tool, and it can usually be used in combination: prometheus + grafana (open source, customizable indicators and alarms); zabbix / nagios (host and service monitoring); datadog / new relic (hosted application performance and integrated logs); netdata (lightweight real-time monitoring). the network layer can introduce thousandeyes or pingdom for global synthetic monitoring; the security layer uses cloudflare spectrum or akamai to prevent ddos. consider local network probe coverage, language support, and data residency policies when selecting.
how to deploy and configure these monitoring tools to improve fault response speed?
deployment recommendations are divided into three steps: first, tracking and collection, using node agent to collect host and application indicators, and reporting to prometheus through exporter or directly sending to cloud services; second, visualization and dashboard, establishing grafana by region (kr) and service dimensions panel, set key slo and delay curve; third, alarm and automation, integrate alarms with slack/discord/enterprise wechat, pagerduty, set graded alarms (warning/severe/fatal) and automated repair scripts (such as automatically restarting processes, expanding instances). also establish a runbook and sop to ensure that the team knows the next step when an alarm is triggered.
why do we need to develop separate localized monitoring and alarm strategies for korean nodes?
south korea's network environment, operators, and peak hours are different from other regions. localized monitoring can capture problems that are difficult to detect through transnational monitoring (such as isp intranet packet loss, domestic cdn back-to-source bottlenecks). in addition, the korean community has high expectations for response speed and service stability. establishing localized alarm thresholds, using probes in the capital area and second-tier cities, and cooperating with korean customer service channels will significantly improve user perception quality and brand reputation.
how to evaluate and choose the most appropriate monitoring solution?
consider when evaluating: observability coverage (whether it covers network/system/application/synthetic monitoring), scalability and performance overhead, alarm accuracy (false positive/false negative rate), integration capabilities (log/tracing/alarm channels), cost and operation and maintenance complexity, and localization support. it is recommended to do a poc (small traffic, single area) first to verify latency data, alarm stability and dashboard response, and then gradually expand to production.
which optimization measure can directly improve the online experience of korean players and reduce disconnections?
optimization measures include: deploying regionalized edge servers or game workloads in korean computer rooms, using intelligent routing (bgp policies based on delay and packet loss), enabling qos and network congestion control, using elastic expansion to reduce cold start delays, optimizing matching strategies to reduce cross-regional matching, and adding synthetic monitoring to detect jitter in real time. in terms of security, it combines ddos protection and connection frequency limiting strategies to prevent large-scale disconnections caused by network attacks.
how to transform monitoring data into operational output for continuous improvement?
establish sla/slo, and conduct correlation analysis between monitoring data and business indicators (such as retention, payment conversion, complaint rate); regularly conduct post-incident analysis (rca), convert monitoring blind spots into new collection indicators, update alarm thresholds and runbooks; organize drills (game day) to test automated repairs and communication links. in the long term, incorporating observation data into capacity planning and deployment strategies can significantly reduce the frequency and impact of emergencies.
- Latest articles
- Key Considerations Regarding Qualifications And Technical Support When Selecting A Service Provider For The CN2 Server Cluster In South Korea
- Recommended Singapore IPLC Dedicated Servers For Security And Compliance – Case Studies On Data Encryption And Dedicated Channel Deployment
- A Practical Guide For Nationwide Deployment Strategies And Network Coverage Optimization Based On Korean Servers
- Actual Measurement Summary Of Hong Kong Native Ip Hong Kong Cn2 Comparison With Other Mainstream Direct Connection Effect Reports
- Anonymity And Ip Pool Size That You Must Pay Attention To When Choosing A Native Proxy Ip In Vietnam
- How To Open A Vps Server In Taiwan? Analysis On Saving Money Strategies With Discounts And Long-term Contracts
- A Step-by-step Explanation Of Common Problems And Rollback Strategies For Vietnam Server Upgrades
- Cn2 Us Dedicated Server Performance Comparison And Enterprise Rental Guide Detailed Explanation
- How To Make Japanese Cloud Server Comparison And Purchase Decisions Based On Business Scenarios
- Stability Evaluation Of Taiwan’s Native Residential Ip’s Packet Loss And Delay Performance Under Long-term Connections
- Popular tags
-

Revealing And Analyzing The Truth About Whether The Taiwan Server Is In South Korea
in-depth analysis of the truth about whether the taiwan server is in south korea and discussion of related issues. -

Recommend Several Cost-effective Korean Rental Servers
we recommend several cost-effective korean rental servers, including high-quality service providers such as dexun telecom, suitable for users with various needs. -
Selection Recommendations: The Best Cost-effective Configuration Within The Price Range Of Korean High-defense Servers
this article evaluates korean high-defense servers at different price points in detail, and gives the best cost-effective configuration suggestions in each price range, covering protection capabilities, bandwidth, hardware, latency and operation and maintenance suggestions, to help enterprises and individuals choose the most suitable korean high-defense servers.